Introduction
Vision-Language Models (VLMs) (Bai et al., 2025; Dubey et al., 2024) offer unprecedented capabilities to process and understand vision-language data. Built upon powerful Large Language Model (LLM) (Brown et al., 2020) architectures, these models seamlessly integrate visual and textual inputs, enabling sophisticated reasoning and interaction across diverse input types. Recently, industry shows an increasing preference for VLMs (Peng et al., 2023; Anil et al., 2023; Zhu et al., 2025) that provide a unified framework that excels in both text-only and vision-language tasks. VLMs provide users with a seamless experience, as they can accomplish various tasks through a single, versatile system.
However, improving VLMs on vision-language tasks has unintentionally compromised their capabilities on text-only tasks. Empirical evidence from NVLM (Dai et al., 2024) reveals significant performance declines across leading models. VILA-1.5 40B (Lin et al., 2024) experiences a 6.9 points drop in text-only tasks, while LLaVA-OneVision 72B (Liu et al., 2024) and InternVL-2-Llama3-76B (Chen et al., 2023; Chen et al., 2024) show comparable decreases of 6.3 and 6.9 points, respectively.
Existing methods address this challenge through freezing partial LLM backbones, increasing model size, or incorporating additional high-quality text-only data. Llama 3-V (Dubey et al., 2024) froze the LLM backbone during the vision-language instruction-tuning (VLIT) stage to preserve the model's language capabilities. However, other studies (Dai et al., 2024; Alayrac et al., 2022) report degraded performance on vision-language tasks with this approach. NVLM (Dai et al., 2024) takes an alternative approach by scaling up model size while maintaining frozen LLM layers.
Recent advanced VLMs such as DeepSeek-VL (Lu et al., 2024), MM1 (McKinzie et al., 2024), Bunny (He et al., 2024), and NVLM (Dai et al., 2024) have been designed with intricate combinations of text-only and vision-language data for the VLIT stage. While promising, this method introduces significant computational and data overhead. Notably, current approaches focus on workarounds rather than investigating the root cause of degraded language capabilities.
We reveal the root cause of declined language capabilities. Since the LLM backbone is only modified during the VLIT stage, the root cause of language capability degradation originates in this stage. Our analysis in Section 4.1 reveals that as the training loss of the VLIT stage decreases, the distance between textual and visual representations will also decrease. We term the phenomenon of reduced distance as representation mixing. Furthermore, our findings in Section 4.2 indicate that the representation mixing within the post-representation layers is a critical factor contributing to the diminished language capabilities. The post-representation layers are the first few layers of the LLM backbone involved in representation learning.
To mitigate the degradation of language capabilities, we propose Representation Regulation for VLM training (RRVLM), a method integrated into the VLIT stage of VLM training. Specifically, we introduce a Representation Distribution Difference (RDD) loss to reduce the average distance between textual and visual embeddings which are the inputs of the post-representation layers. Our method not only preserves the language capability but also enhances vision-language capabilities for the following reasons. First, by shifting representation mixing to the earlier layers before the post-representation layers, it alleviates the representation mixing within the post-representation layers, thus alleviating the language degradation. Second, we prove that minimizing the RDD loss can reduce the distance between two representations, consequently decreasing empirical risk during the VLIT stage, thus enhancing vision-language capabilities. Compared to previous methods, our method eliminates the need for architectural modifications, making it broadly applicable to most VLMs at a low cost.
The contributions are summarized as follows,
- Our theoretical analysis identified the cause of the decline in language capabilities in VLMs.
- We propose representation regulation (RRVLM) which is integrated into the VLIT stage of VLM training. Within the RRVLM framework, we propose Representation Distribution Difference loss to reduce the distance between visual and textual representations.
- Extensive experimental results show that RRVLM preserves the language capabilities of VLMs and enhances vision-language capabilities.
Related Work
Mitigating Language Degradation in VLMs
A recent study (Dai et al., 2024) reveals significant performance declines across leading models include VILA-1.5 40B (Lin et al., 2024), LLaVA-OneVision 72B (Liu et al., 2024), and InternVL-2-Llama3-76B (Chen et al., 2023; Chen et al., 2024). There are three categories of methods for mitigating language degradation.
The first category preserves language capabilities by freezing partial LLM parameters. NVLM (Dai et al., 2024) froze the LLM parameters and trained only the cross-attention layers in their proposed NVLM-X framework. Attention-Tuning (Dubey et al., 2024) freezes the LLM backbone while making only the attention layers tunable. Studies in (Srivastava et al., 2024) demonstrate that using LoRA (Hu et al., 2022), which maintains fixed LLM parameters while keeping adaptation matrices trainable, helps alleviate language degradation. SPIDER (Huang et al., 2024) selectively updates parameters based on their importance. The second category augments vision-language data with additional text data during the VLIT stage. Recent advanced VLMs such as DeepSeek-VL (Lu et al., 2024), MM1 (McKinzie et al., 2024), Bunny (He et al., 2024), and NVLM (Dai et al., 2024) have designed intricate combinations of text-only and vision-language data for the VLIT stage. The third category encompasses diverse approaches to address language degradation from various perspectives. ModelMerge (Ratzlaff et al., 2024) posits that VLMs experience catastrophic forgetting after the VLIT stage. It merged the base LLM parameters back into language model parameters of the VLM after the VLIT stage. SoftLabel (Harun and Kanan, 2024) formulated degraded language capabilities as a catastrophic forgetting problem in continuous learning. It hypothesized that increased training loss when learning new tasks causes forgetting, and addressed this by reducing initial training losses through smoothed labels rather than hard labels. WINGS (Zhang et al., 2024) observed that the attention shift is related to language degradation and proposed to add a trainable module into the original attention layers to compensate for the attention shift.
Preliminary
Physical VLM Architecture
VLM typically consists of four components: the text embedding layer, a vision encoder, the vision projection layer, and the LLM decoding layers. (1) The text embedding layer ($p_t$) refers to the embedding layer of the LLM backbone. It generates text embeddings given a sequence of text tokens. (2) The vision embedding generator ($p_v$) consists of two sequential components, namely, a vision encoder followed by a vision projection layer. The vision encoder extracts visual features from raw visual inputs. It is often pre-trained on large-scale image datasets such as WIT (Radford et al., 2021), enabling robust visual feature extraction. CLIP (Radford et al., 2021) and BEiT (Bao et al., 2022) are widely used vision encoders in the VLM. The vision projection layer serves as the critical bridge between visual and language modalities by transforming visual features into the same embedding space as language modality. The inputs of vision projection layer are visual features generated by the vision encoder. The outputs of vision projection layer are termed vision embeddings. The vision projection layer can be a simple linear layer (Liu et al., 2023) or more capable Transformer blocks (Awadalla et al., 2023; Dai et al., 2023). (3) The LLM decoding layers ($g$) refers to the LLM backbone excluding the text embedding layer. It takes the concatenation of text embeddings and vision embeddings as inputs and generates textual outputs.
VLMs process vision-language inputs by augmenting the LLM backbone with a vision embedding generator to process visual inputs.
Textual inputs pass through a text embedding layer, while visual inputs are transformed by the vision embedding generator. The resulting textual and visual embeddings are then jointly processed by the LLM decoding layers, enabling reasoning across both modalities.
Abstract VLM Architecture
From a functional perspective, a VLM can be decomposed into distinct components dedicated to representation learning and prediction. We formalize the VLM from this perspective as follows. The raw textual input $x$ and raw visual input $y$ are mapped into a unified representation space by the text representator $h_t$ and vision representator $h_v$, respectively. The output of text representator \(h_t(x) \in X \) and the output of vision representator \( h_v(y) \in Y \) are concatenated and fed into the predictor \( f \), generating the final textual output. $X$ denotes the set of all possible textual representations generated by the text representator given any input. $Y$ denotes the set of all possible visual representations generated by the vision representator given any input.
We map abstract VLM components to their physical implementations. Since the text embedding layer serves as the first component to process raw textual input, the text representator \( h_t \) component includes at least the text embedding layer $p_t$. Similarly, the vision representator \( h_v \) includes at least the vision embedding generator $p_v$. In the simplest case, $h_t$ equals the text embedding layer $p_t$, $h_v$ equals the vision embedding generator $p_v$, and the predictor $f$ corresponds directly to the LLM decoding layers $g$.
However, some studies (Schwettmann et al., 2023; Neo et al., 2024) suggest that initial LLM layers continue sophisticated representation learning for both textual and visual inputs. Hence, the text representator $h_t$ and vision representator $h_v$ likely include the first few layers of LLM decoding layers, which we term post-representation layers ($r$). The remaining LLM layers serve as the predictor $f$. The inputs of post-representation layers are visual and textual embeddings. Post-representation layers further transform the visual and textual embeddings ($p_v(y)$ and $p_t(x)$) into more sophisticated representations. The outputs of post-representation layers are termed as visual representation and textual representation. Notably, throughout this paper, we maintain a clear distinction between visual (textual) embedding and visual (textual) representation. Fig. 1 (b) illustrates this correspondence between physical implementations and abstract components.
VLM Training
The VLM training consists of two stages. The first stage is Vision-Language Pre-training, which aims to align representations of visual and language modalities. In this stage, the LLM backbone is frozen. This indicates that there is no decline in the LLM's language capabilities during the first training stage. The second stage is Vision-Language Instruction-tuning (VLIT). In this stage, many components including the LLM backbone are all trainable, which introduces potential degradation in language capabilities. Consequently, our analysis primarily focuses on the second training stage.
The VLIT dataset $S$ is defined as $S=\{ \left(x_{1}, y_{1}, z_{1}\right), \ldots, \left(x_{n}, y_{n}, z_{n}\right) \}$ where $n$ is number of samples in the dataset, and $y$ represents raw visual input, $x$ represents the raw textual input, $z$ represents the textual ground-truth. Tasks in this stage include visual question answering (Antol et al., 2015) and image captioning (Schuhmann et al., 2022). For example, in the visual question task, $x$ is the question, $y$ is an image, and $z$ is the caption of the given image.
In the VLIT stage, both the vision representator $h_v$, text representator $h_t$, and predictor $f$ are trainable.
The empirical risk for this stage can be formulated as
where $\ell(\cdot)$ is a specific loss function, e.g., cross-entropy.
VLMs can not only handle vision-language tasks but also text-only tasks. We can use the evaluation loss to measure the performance on the text-only tasks. The evaluation loss on text-only tasks can be formulated as
where $S^{\prime}=\{ \left(x^{\prime}_1, z^{\prime}_1\right), \ldots,\left(x^{\prime}_m, z^{\prime}_m\right) \}$ where $m$ is number of samples in the test set $S^{\prime}$, $x^{\prime}$ represents textual input, $z^{\prime}$ represents textual ground-truth.
Theoretical Analysis
Since the LLM backbone is only modified during the VLIT stage, the cause of language capability degradation must originate in this stage. Hence, we analyze the training dynamics of the this stage. In Section 4.1, we find that as the training loss declines, the visual representation and textual representation move closer to each other, a phenomenon we term “representation mixing.'' In Section 4.2, we prove that the representation mixing occurring within the post-representation layers is the cause of the degradation of language capabilities.
Training Dynamics of VLM
We first analyze what happens as the loss function decreases in the VLIT stage by deriving the lower bound of the training loss.
Assume that the loss $\ell$ increases noticeably when the model prediction deviates from the oracle prediction, and that the model prediction changes noticeably when the visual representation deviates from the optimal visual representation; both assumptions are formally stated in Appendix A. Then for any $\delta>0$, with probability at least $1-\delta$ over the draw of the sample $S$ of size $n$, we have
Here $\mathbb{E}_{S}[\cdot]$ denotes the population expectation with respect to the data distribution over the VLIT dataset $S$, and $\mathcal{L}_{\mathrm{VLIT}}(h_t,h_v,f)$ is the empirical VLIT loss defined in Eq. (1). Other notations such as $S$, $x_i$, $y_i$, $z_i$ and $n$ follow the definitions in the preliminaries. $G(\Phi(S_{xy}))$ is defined in Appendix A. The $\pi, m,\alpha,\beta$ and $R$ are constants.
Due to space limitation, the proof is presented in Appendix A.
Theorem 1 shows the training loss of the VLIT stage has a lower bound consisting of three terms. As the loss decreases, these three terms must collectively decrease. However, as the number of training samples $n$ is typically large, the second terms approach zero and the last term is constant. Therefore, the declining loss primarily leads to a reduction in the first term. It indicates that during the VLIT stage, the average distance between visual and textual representations decreases. We term this phenomenon as Representation Mixing. In the VLIT stage, with all components of the VLM being trainable, the visual representation can move closer to the textual representation, and the textual representation can also shift toward the visual representation. Consequently, we can further conclude that during this training process, both representations move closer to each other.
Degradation of Language Capability
We investigate the root cause of language capability degradation by establishing a lower bound for the difference between evaluation losses on text-only tasks measured before and after VLIT stage.
Let $b$, $a$ denote the VLM before and after vision-language instruction-tuning (VLIT) respectively. We have:
where $\mathcal{D}^{a} = \mathbb{E}_{S}\bigl[\bigl\|h^a_t(x)-h^a_v(y)\bigr\|\bigr]$, $\mathcal{L}_{text}^{a} = \frac{1}{m} \sum_{i=1}^{m} \ell\left(f^{a}( h_t^{a}(x_i)), z_i\right)$ is the evaluation loss of VLM $a$ on text-only tasks, $x_i$ is textual input, $z_i$ is textual ground-truth. $f^{a}$ and $h_t^{a}$ are the predictor, and text representator of VLM $a$ respectively. For VLM $b$, we use analogous notations including $\mathcal{D}^{b}$, $\mathcal{L}^{b}_{text}$, $f^{b}$, and $h_t^{b}$, where $b$ replaces $a$ in the subscripts. $\Delta_{\mathrm{vis}}$, $\varepsilon_{\mathrm{corr}}$, $\eta_v$ and $\varepsilon_{\mathrm{adapt}}$ are constants. $R$ is a positive constant consistent with Theorem 1.
Due to space limitation, the proof is shown in Appendix B. Theorem 2 shows that representation mixing is the cause of the degradation of language capability. Theorem 1 states that as training progresses, the distance \(\mathbb{E}_{S}\bigl[\|h_t(x)-h_v(y)\|\bigr]\) gradually decreases. The representation distance in VLM $a$ is smaller than that in VLM $b$, which means \(\mathcal{D}^b-\mathcal{D}^a \ge 0\). Given that $\Delta_{\mathrm{vis}}$ is a large positive value while $\eta_v$, $\varepsilon_{\mathrm{corr}}$ and $\varepsilon_{\mathrm{adapt}}$ are small positive constants, the right-hand side of Eq. (4) is likely to be positive. It means the evaluation loss on text-only task increases after VLIT stage, i.e., $\mathcal L_{\mathrm{text}}^a \ge \mathcal L_{\mathrm{text}}^b$. This suggests that a degradation in language capability is theoretically guaranteed, driven by representation mixing (i.e., \(\mathcal{D}^b-\mathcal{D}^a \ge 0\)).
To identify the specific components responsible for performance degradation, we analyze where representation mixing occurs. We substitute the abstract components $h_t$ and $h_v$ in the distance definition $\mathcal{D}$ with physical components: $h_t(x) = r(p_t(x))$ and $h_v(y) = r(p_v(y))$, where $r$ denotes the post-representation layers, $p_t$ is the text embedding layer, $p_v$ is the vision embedding generator. Only $r$, $p_t$ and $p_v$ are involved in the distance computation. During inference on text-only tasks, only three components are active, i.e., the text projector $p_t$, the post-representation layers $r$, and the predictor $f$. By intersecting the components involved in distance computation with those active during inference, we narrow our investigation to $p_t$ and $r$. Since $p_t$ is a simple embedding layer that remains largely stable during training, the post-representation layers $r$ are the primary drivers of representation mixing. Consequently, the degradation of language capability stems from the representation mixing occurring within post-representation layers.
Method
Motivation
Theorem 2 reveals that representation mixing within the post-representation layers causes language capability degradation. Increasing the distance between two representations might seem like a straightforward solution. However, Theorem 1 reveals that it is necessary to reduce the distance between two representations to improve vision-language capabilities because the empirical risk during the VLIT stage is lower bounded by the distance between two representations. Also, identifying which layers in the LLM backbone correspond to the post-representation layers is non-trivial, because the LLM backbone itself has a complex architecture.
Hence, an effective solution must (1) maintain sufficiently small distances between textual and visual representations for strong vision-language capabilities, (2) alleviate representation mixing within post-representation layers, and (3) achieve the above two objectives without assuming that we know which layers in the LLM backbone correspond to the post-representation layers.
These three objectives can be achieved simultaneously. Note that the post-representation layers operate on both vision and text embeddings and perform representation mixing on top of them. If there is already a large discrepancy between the vision and text embeddings from the beginning, the post-representation layers must expend significantly more effort to carry out effective representation mixing. Therefore, a simple yet effective strategy is to reduce the distance between vision embeddings and text embeddings. The vision embeddings and text embeddings are the output of $p_v$ and $p_t$, respectively.
By facilitating distance reduction before the post-representation layers, our method can alleviate mixing within the post-representation layers. While our approach does not eliminate representation mixing within the post-representation layers entirely, it shifts this process to earlier stages, relieving the burden of the post-representation layers, thus maintaining language capabilities.
Representation Distribution Difference Loss
Specifically, we propose a Representation Regulation method for VLM (RRVLM), a novel method integrated into the VLIT stage. This approach introduces a Representation Distribution Difference (RDD) loss to minimize the average distance between textual and visual embeddings prior to the post-representation layers, mitigating the degradation of the language capabilities.
Our goal is to reduce the distribution discrepancy between textual and visual embeddings across the entire dataset. However, during training, the loss is applied per mini-batch, and thus we need a batch-computable surrogate that measures distribution difference reliably. According to (Gretton et al., 2012), kernel methods provide an effective way to measure the discrepancy between two distributions via their embeddings in a reproducing kernel Hilbert space (RKHS).
We introduce a kernel function \( \phi (\cdot) \) to project the text embedding \( p_t(x_i) \) and visual embedding \( p_v(y_i) \) into the reproducing kernel hilbert Space \( \mathcal{H} \) for distance computation. The approximated distance is formulated as:
The distance in expectation form would be written in the discrete form:
We minimize $\mathcal{L}_{rdd}$ during optimization.
Training
As shown in Fig. 1 (a), raw visual and textual inputs are processed through the vision embedding generator and text embedding layer, respectively, producing visual and textual embeddings. These embeddings are fed into the LLM decoding layers to calculate the next token prediction loss. Additionally, the embeddings are utilized to compute the RDD loss. Finally, two objective functions Eq. (1) and Eq. (6) are optimized jointly.
Experiment
| Methods | Language Capability | Vision-Language Capability | |||||||
|---|---|---|---|---|---|---|---|---|---|
| MMLU↑ | ARC_E ↑ | ARC_C ↑ | O.B.QA ↑ | Avg↑ | MMMU ↑ | MME_P ↑ | MME_C ↑ | POPE ↑ | |
| Phi2 + EVACLIP | |||||||||
| LLM (Phi2) | 54.46 | 80.05 | 53.24 | 40.20 | 56.99 | - | - | - | - |
| Full-Tuning | 51.46 | 78.20 | 48.29 | 35.80 | 53.44 | 37.30 | 1307.50 | 247.14 | 85.08 |
| Attention-Tuning | 54.99 | 79.76 | 52.22 | 37.80 | 56.19 | 33.40 | 1298.09 | 278.57 | 81.94 |
| LoRA | 54.69 | 80.77 | 52.30 | 37.60 | 56.34 | 34.90 | 1247.29 | 268.92 | 81.59 |
| SoftLabel | 54.34 | 79.50 | 49.40 | 37.00 | 55.06 | 36.10 | 1308.73 | 270.00 | 83.87 |
| ModelMerge | 54.12 | 80.22 | 50.26 | 37.80 | 55.60 | 36.20 | 1308.97 | 248.57 | 85.25 |
| RRVLM (our) | 55.81 | 82.28 | 53.41 | 39.80 | 57.83 | 37.40 | 1326.07 | 293.57 | 85.32 |
| Phi2 + SigLIP | |||||||||
| LLM (Phi2) | 54.46 | 80.05 | 53.24 | 40.20 | 56.99 | - | - | - | - |
| Full-Tuning | 51.12 | 78.16 | 47.78 | 36.60 | 53.42 | 36.80 | 1382.50 | 308.92 | 83.92 |
| Attention-Tuning | 54.50 | 79.88 | 51.45 | 38.40 | 56.06 | 35.40 | 1325.10 | 302.85 | 83.17 |
| LoRA | 54.30 | 80.35 | 51.71 | 38.60 | 56.24 | 33.60 | 1292.35 | 245.71 | 83.39 |
| SoftLabel | 53.33 | 78.32 | 49.15 | 37.20 | 54.50 | 36.30 | 1386.80 | 306.42 | 83.75 |
| ModelMerge | 53.14 | 79.67 | 50.09 | 37.80 | 55.18 | 36.70 | 1363.26 | 301.42 | 83.70 |
| RRVLM (our) | 54.59 | 82.32 | 53.84 | 40.60 | 57.74 | 37.30 | 1390.28 | 311.42 | 84.35 |
| Methods | Language Capability | Vision-Language Capability | |||||||
|---|---|---|---|---|---|---|---|---|---|
| MMLU↑ | ARC_E ↑ | ARC_C ↑ | O.B.QA ↑ | Avg↑ | MMMU ↑ | MME_P ↑ | MME_C ↑ | POPE ↑ | |
| Phi2 + EVACLIP | |||||||||
| LLM (Phi2) | 54.46 | 80.05 | 53.24 | 40.20 | 56.99 | - | - | - | - |
| DSVL Mixing | 52.36 | 79.84 | 49.15 | 39.00 | 55.08 | 35.20 | 1258.97 | 245.00 | 84.59 |
| Attention-Tuning | 54.85 | 79.80 | 51.37 | 39.00 | 56.26 | 35.10 | 1253.91 | 277.50 | 82.43 |
| LoRA | 54.21 | 80.22 | 52.39 | 39.40 | 56.56 | 35.60 | 1236.69 | 284.28 | 81.37 |
| SoftLabel | 54.72 | 79.08 | 50.68 | 37.40 | 55.47 | 36.40 | 1239.73 | 257.50 | 84.07 |
| ModelMerge | 54.73 | 79.59 | 51.54 | 38.20 | 56.02 | 35.80 | 1271.07 | 243.57 | 84.69 |
| RRVLM (our) | 55.15 | 84.01 | 54.78 | 40.40 | 58.59 | 36.90 | 1267.53 | 337.14 | 84.97 |
| Phi2 + SigLIP | |||||||||
| LLM (Phi2) | 54.46 | 80.05 | 53.24 | 40.20 | 56.99 | - | - | - | - |
| DSVL Mixing | 53.57 | 79.63 | 48.12 | 38.00 | 54.83 | 35.80 | 1265.70 | 283.92 | 83.90 |
| Attention-Tuning | 54.63 | 79.88 | 52.65 | 39.40 | 56.64 | 35.70 | 1275.29 | 320.35 | 82.80 |
| LoRA | 55.26 | 80.09 | 52.39 | 39.20 | 56.74 | 37.10 | 1314.97 | 260.71 | 82.61 |
| SoftLabel | 54.17 | 78.75 | 49.83 | 37.20 | 54.99 | 37.10 | 1308.47 | 308.92 | 83.91 |
| ModelMerge | 54.38 | 79.92 | 51.17 | 39.20 | 56.17 | 36.00 | 1273.64 | 295.00 | 83.61 |
| RRVLM (our) | 55.70 | 83.71 | 54.44 | 40.58 | 58.38 | 37.10 | 1333.20 | 344.64 | 84.16 |
Experimental Settings
Benchmarks. To evaluate the vision-language capabilities, benchmarks are MMMU (Yue et al., 2024), MME Perception (MME_P) (Fu et al., 2023), MME Cognition (MME_C) (Fu et al., 2023), and POPE (Li et al., 2023). To evaluate language capabilities, the benchmarks are MMLU (Hendrycks et al., 2021), ARC_E (Clark et al., 2018), ARC_C (Clark et al., 2018), and OpenBookQA (O.B.QA) (Mihaylov et al., 2018).
Compared Methods. We compared our method with the following approaches. Attention-Tuning, LoRA (Hu et al., 2022), SoftLabel (Harun and Kanan, 2024), ModelMerge (Ratzlaff et al., 2024), and DSVL Mixing. Due to space limitation, we provide detailed information in Appendix C.
Settings. Since DSVL Mixing uses additional text-only data while other methods do not, to ensure fair comparison, we establish two settings, namely, with and without additional text-only data in the experiments. In the setting that includes additional text-only data, all methods were trained using identical data combinations as DSVL Mixing. To ensure fair comparison, we carefully controlled the total training volume across both settings. In the setting that incorporates additional text-only data, we systematically reduced the vision-language samples by an equivalent amount. This ensures that any performance differences observed between methods reflect their algorithmic capabilities rather than variations in overall training data quantity.
| Methods | Language Capability | Vision-Language Capability | |||||||
|---|---|---|---|---|---|---|---|---|---|
| MMLU↑ | ARC_E ↑ | ARC_C ↑ | O.B.QA ↑ | Avg↑ | MMMU ↑ | MME_P ↑ | MME_C ↑ | POPE ↑ | |
| Phi2 + EVACLIP | |||||||||
| LLM (Phi2) | 54.46 | 80.05 | 53.24 | 40.20 | 56.99 | - | - | - | - |
| Full-Tuning | 51.46 | 78.20 | 48.29 | 35.80 | 53.44 | 37.30 | 1307.50 | 247.14 | 85.08 |
| RRVLMEuclidean | 54.25 | 79.88 | 50.09 | 38.20 | 55.61 | 35.80 | 1319.11 | 273.57 | 84.47 |
| RRVLM (our) | 55.81 | 82.28 | 53.41 | 39.80 | 57.83 | 37.40 | 1326.07 | 293.57 | 85.32 |
| Kernel Type | Bandwidth | ||||
|---|---|---|---|---|---|
| Method | Language | Vision-Language | Method | Language | Vision-Language |
| LLM (Phi2) | 54.46 | - | LLM (Phi2) | 54.46 | - |
| Full-Tuning | 51.46 | 37.30 | Full-Tuning | 51.46 | 37.30 |
| RRVLM (Linear Kernel) | 54.88 | 36.20 | RRVLM (0.5× Mean Heuristic) | 54.55 | 36.80 |
| RRVLM (Polynomial Kernel) | 55.03 | 36.90 | RRVLM (2× Mean Heuristic) | 55.09 | 37.15 |
| RRVLM (RBF Kernel) | 55.81 | 37.40 | RRVLM (Mean Heuristic) | 55.81 | 37.40 |
VLM Framework and Backbones. Our experiments are conducted across three prominent multimodal frameworks including Bunny (He et al., 2024), LLaVA (Liu et al., 2023), and NVILA (Liu et al., 2025). The details of backbones within each framework are shown in Appendix D.
Implementation Details. The implementation details, including training datasets and training settings, are provided in Appendix E.
Main Results
As shown in Tab. 1 and Tab. 2, our method preserves language capabilities while achieving superior performance on vision-language tasks across both settings (with and without additional text-only data). While other baselines have language capability degradation. Moreover, our method performs well on vision-language tasks. This demonstrates our method's ability to excel in both domains without compromising either.
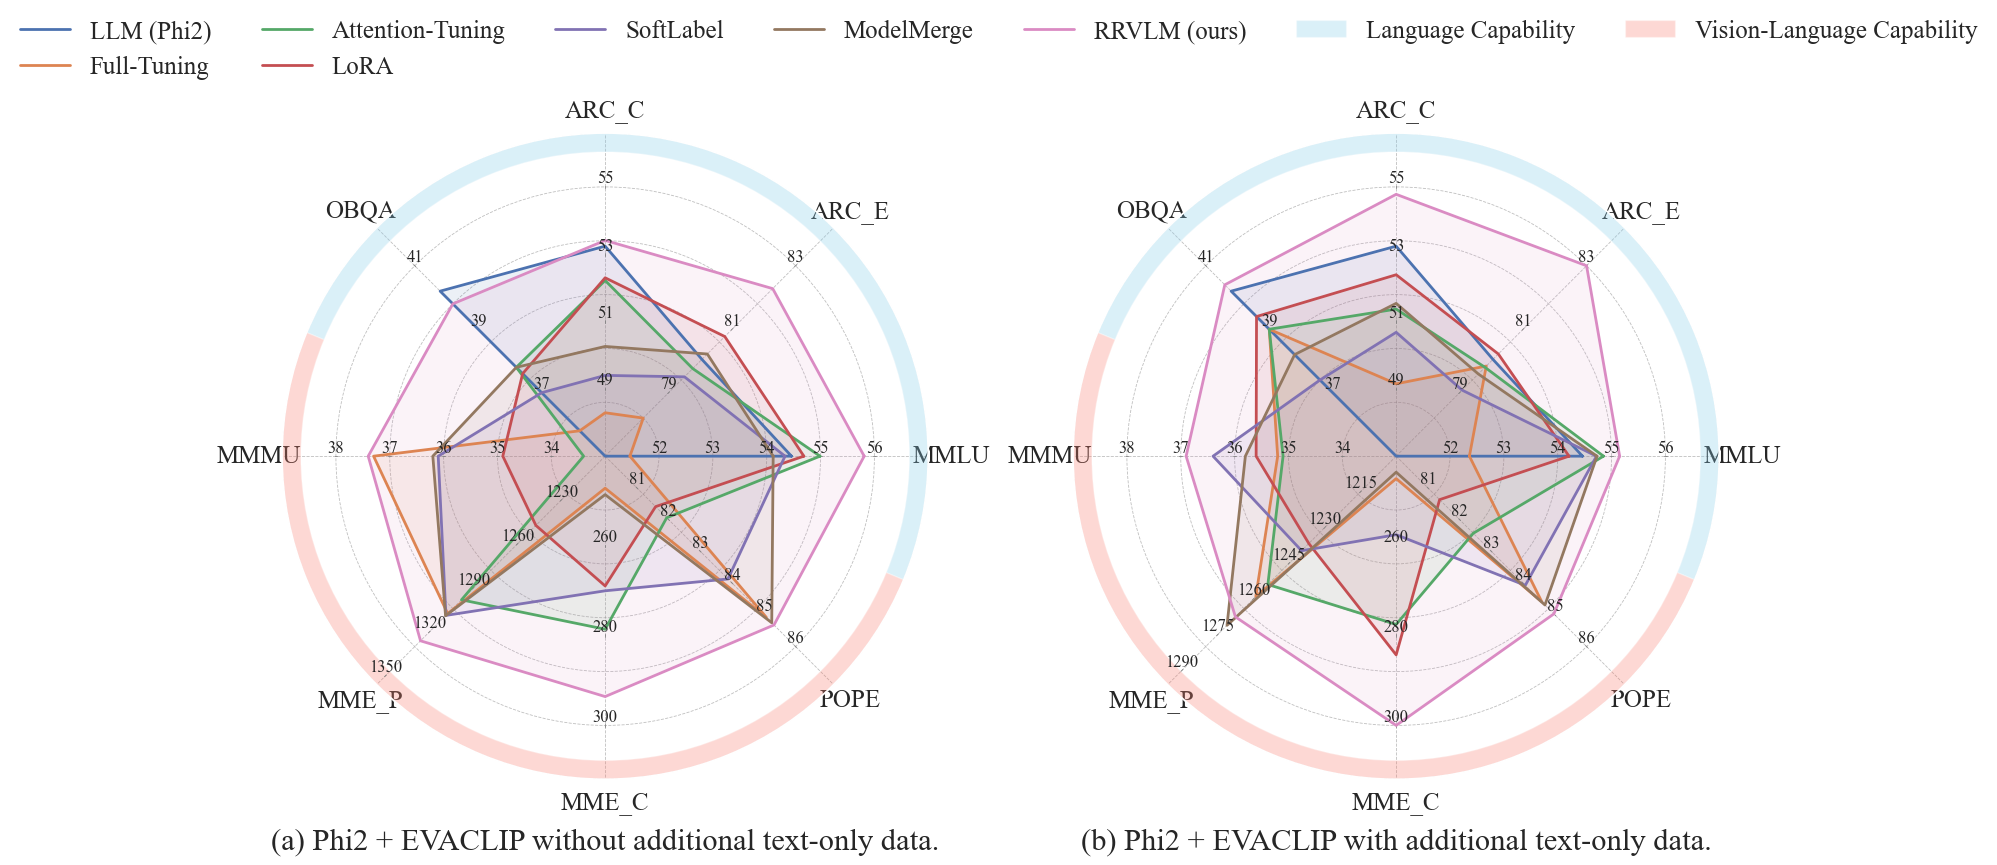
Furthermore, when additional text-only data is incorporated, all methods show improved performance in language capability evaluations, highlighting the usefulness of text-only data for preserving language capabilities. However, with the inclusion of text-only data, the performance of all methods on vision-language benchmarks declines, except on the MME_C benchmark (Fu et al., 2023). This indicates that data mixing may negatively impact vision-language capabilities. The MME_C benchmark includes common-sense reasoning, numerical calculation, text translation, and code reasoning tasks. Text-only data is particularly beneficial for the latter three tasks, which explains why performance on MME_C improves when text-only data is used. Fig. 2 demonstrates that our method encompasses a substantially larger area, confirming its comprehensive superiority in both preserving language capabilities and enhancing vision-language performance.
Additional results of more VLM backbones, presented in Appendix F, further corroborate the above findings. Further case study in Appendix H examines our method's performance on text-only tasks, confirming its ability to preserve language capabilities.
Ablation Study on RDD Loss
In this section, we present an ablation study on RDD loss. We compare RRVLM trained with RDD loss against RRVLM using Euclidean distance regulation loss (L2 loss). The Euclidean distance regulation loss aims to minimize the Euclidean distance between visual and textual embeddings, serving as a straightforward implementation of the objective proposed in our motivation section. As shown in the Tab. 3, RRVLM using the RDD loss best preserves language capabilities while achieving superior performance on vision-language tasks, demonstrating the effectiveness of RDD loss. On the other hand, RRVLM trained with L2 loss also retains language capabilities to some extent. Since the L2 loss can be regarded as a coarse approximation of our theoretically derived objective, this further provides experimental validation for the soundness of our theoretical analysis and core motivation.
Representation Mixing
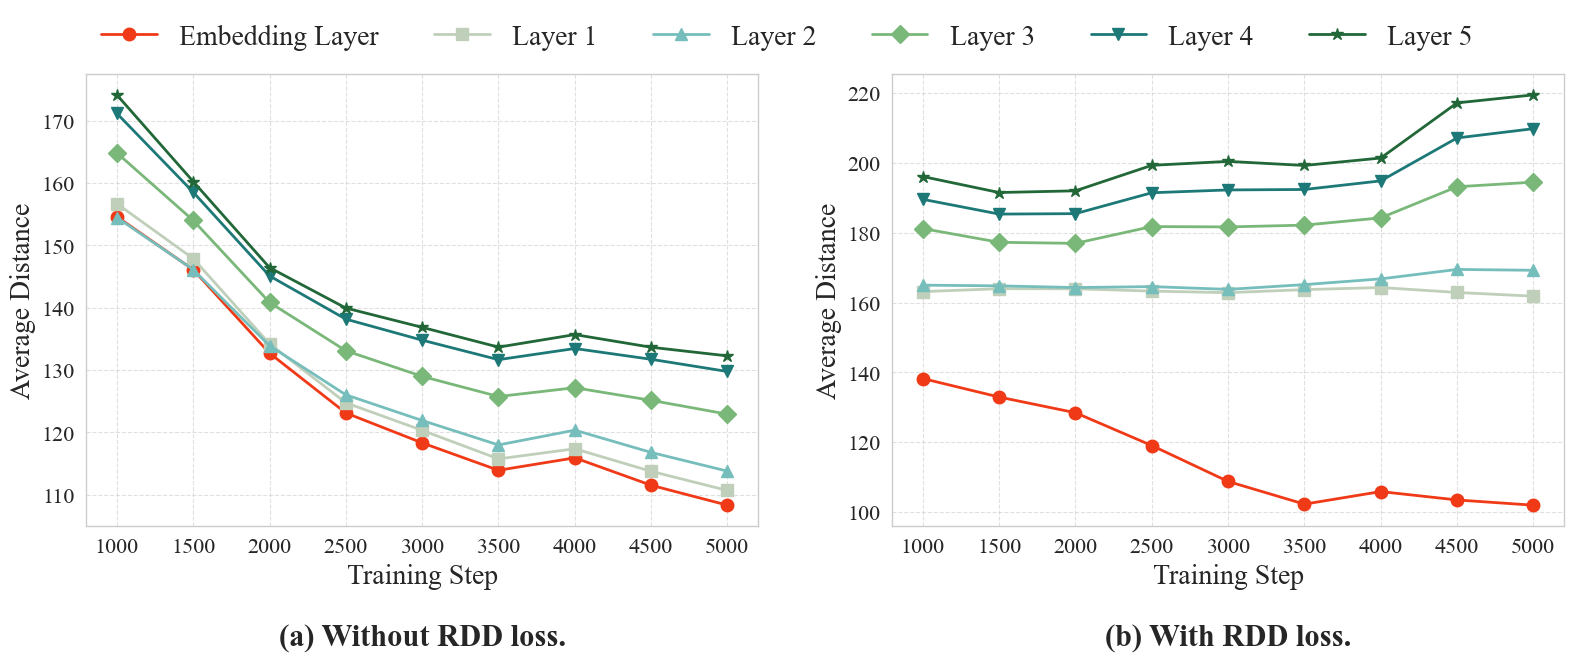
To investigate the phenomenon of Representation Mixing during the VLIT stage and the effectiveness of our method in mitigating the degradation in language capabilities, we present the average distances between visual and textual representations in different layers across different training steps. The settings are described in Appendix G.
In Fig. 3 (a), without RDD loss, the distance between textual and visual representations decreases during the VLIT stage, supporting Theorem 1. In Fig. 3 (b), when applying RDD loss, the distance in the embedding layer decreases, confirming the effectiveness of the RDD loss. Meanwhile, the distance in the first few layers increases as the training process progresses, effectively mitigating representation mixing within the first few layers and thus preserving language capabilities.
Hyperparameter Analysis
We provide an analysis on the kernel type and bandwidth selection strategies in the Table 4. The experiment setting is the same with the ablation study in Section 6.3. The strength of regularization can be controlled by selecting different kernel types and bandwidth strategies. The linear kernel provides more robust regularization, while the polynomial kernel imposes a more sensitive regularization. A smaller bandwidth yields stronger and more concentrated regularization, whereas a larger bandwidth leads to weaker and flatter regularization. The Language capability is evaluated using MMLU, the vision-language capability is evaluated using MMMU.
Conclusion
In this paper, we alleviate the degraded language capabilities in VLMs that arise during the vision-language instruction-tuning. We have identified the root cause of language capability degradation in VLMs as “representation mixing'' within post-representation layers. Our proposed solution, Representation Regulation for VLM Training (RRVLM), introduces a Representation Distribution Difference loss that reduces the textual and visual representations, shifting representation mixing to earlier layers, effectively preserving language capabilities while enhancing vision-language performance. Extensive results show that our method is effective.